How scientific findings could help a computer model keep the Chesapeake Bay on its pollution diet
Daniel Pendick
A computer simulation of the Bay runs on Garnet, a supercomputer at the Department of Defense Supercomputing Resource Center in Vicksburg, Mississippi. Carl Cerco, an estuary modeler at the U.S. Army Corps of Engineers (right), works with computer scientist Mark Noel (left) to run simulations of the Bay's water quality. Photograph, Oscar Reihsmann, U.S. Army Corps of Engineers
CARL CERCO HAS A CHESAPEAKE BAY in a box. It resides inside a supercomputer located in a windowless room not far from Cerco's office at a U.S. Army Corps of Engineers research facility in Vicksburg, Mississippi.
In the room, he can hear the low humming of power supplies and the whirring of cooling fans, but not the splash of waves lapping on the wetlands of the Eastern Shore, the slicing of sailboats through the swells, and the clacking of long-handled tongs plucking oysters off reefs.
Cerco is a hydrologist and engineer who has spent the past 30 years working to build the Bay in a box. It is a computer model consisting of thousands of lines of software code. It feeds on gigabytes of data about the water and land and air that make up the estuary's ecosystem, and it uses intertwined mathematical equations to mimic the inner workings of that ecosystem. Like all mimics, Cerco's digital estuary isn't the real thing any more than a miniature ship in a bottle is a functioning sailing vessel. However, both kinds of models can give you a good idea of how something in the real world works — whether it's a sailboat or an ecosystem.
The Bay-in-a-box model is supposed to simulate the Chesapeake accurately enough to help guide a major, multiyear effort to restore the estuary's ecosystem to a more pristine state. Job one for the model is to help the states in the Chesapeake's watershed make adequate progress in cutting down on the main pollutants that undermine the ecosystem's health.
What's in the Bay Model?
Three Models in One
Scientists use a computer model to estimate the amounts of excess nutrients and sediments entering the Chesapeake Bay. They also use it to predict the effects of changing those amounts on the estuary's water quality.
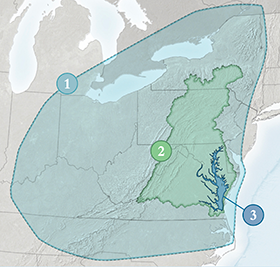
The Bay model consists of three different computer simulations that work in sync to depict the Chesapeake ecosystem:
Map courtesy of NASA Goddard Space Flight Center; Airshed boundaries adapted from Chesapeake Bay Program map
In the sky: The airshed model tracks airborne nitrogen pollutants from cars, power plants, and other sources and estimates how much of these nutrients rain down onto the Chesapeake's watershed and the estuary.
On the land: The watershed model tracks the quantity of pollutants draining into the Chesapeake Bay from its watershed, which covers 64,000 square miles in six states and the District of Columbia.
In the water: The water quality model simulates the effects of nutrients and sediment on water clarity, algae growth, and oxygen levels in the Chesapeake's main-stem and tidal areas. The model, for example, predicts the extent of low-oxygen "dead zones" in the Bay.
"The fundamental question is how much do we have to reduce the load of nutrients and sediment going into the Bay in order to fix the water quality?" says Raleigh Hood, an estuarine researcher and modeler at the Horn Point Laboratory of the University of Maryland Center for Environmental Science (UMCES).
The model has already come up with some answers to the "how much" question. Out of those answers came a "pollution diet" for the Bay. Established in 2010 by the U.S. Environmental Protection Agency, the diet mandates limits on how much nutrient and sediment, measured in millions of pounds per year, the estuary can absorb and still remain relatively healthy. Nutrients feed algae blooms, and when the algae decompose and sink to the Bay's bottom, oxygen is drawn out of the water. The results are extended low-oxygen "dead zones" that harm the estuary's living resources, like fish and crabs. In addition, sediment clouds the Chesapeake's waters and keeps underwater grasses from thriving.
Not everybody is happy with the model's answers or with the pollution diet. To comply with the pollution diet's deadline of 2025, cities have installed expensive upgrades to sewage treatment plants and farmers have increased efforts to reduce runoff of nutrients into the Bay. So a lot is riding on a review by the EPA and its partners in 2017 and 2018 of progress made at this mid-point in the pollution diet timetable. The review could determine whether states and their residents in the Chesapeake region will be required to do even more to restore the estuary.
To inform this review, Carl Cerco and other modelers working for the Chesapeake Bay Program, which is overseeing the pollution diet, are taking a mid-term exam of their own. They have been looking deep inside the Bay in a box to make sure its predictions are as accurate as possible. The modelers are working to incorporate new scientific findings and make upgrades to deal with several unexpected challenges created by natural and man-made changes in the Chesapeake watershed.
Their challenge is to build a better box — a box that can accurately mimic a changing estuary.
Oxygen levels are a key indicator of water quality. In this map generated from a computer simulation of summer 2015 conditions, red and dark orange indicate deep areas of the Chesapeake Bay's mainstem that are especially deprived of oxygen, creating "dead zones." Graphic by Aaron Bever (Anchor Qea) and Marjorie Friedrichs (Virginia Institute Of Marine Science)
Conowingo Surprise
The modelers have built the Bay in a box based on a series of assumptions about how the estuary and its component parts work, assumptions informed by the best available data and analysis. When Cerco and his colleagues created the 2010 version of the Bay model, one of their key assumptions held that a mile-wide dam across the lower Susquehanna River was playing a key role in the estuary's water quality. It was a conclusion that, thanks in part to a tropical storm, modelers would later rethink.
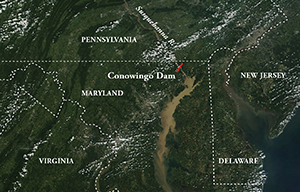
The Conowingo Dam lies just north of where the river meets the head of the Chesapeake Bay. Opened in 1929, the dam stores water to run through the facility's turbines and create electricity. But the Conowingo has also provided a fortuitous benefit for the estuary's water quality. The dam has served as a bulwark; millions of tons of sediments and the nutrients bound to them have settled in the reservoir upstream of the dam instead of pouring into the Bay. For decades the nutrients and sediments had flowed from cities, subdivisions, and farms, traveled down the Susquehanna, and steadily accumulated as muck in the 9,000-acre reservoir behind the dam.
In 2010, when the Bay model was used to calculate the pollution diet, the best estimates available suggested that Conowingo might keep trapping nutrients and sediments for perhaps 15 to 30 more years.
But by 2011, new evidence suggested those estimates needed to be revised. Research by Robert Hirsch, a hydrologist for the U.S. Geological Survey, had raised concerns that the Conowingo's trapping capacity had declined.
"Then Tropical Storm Lee happened," Hirsch recalls.
In September 2011, Lee dumped as many as 12 inches of rain on parts of the Susquehanna basin, causing massive flooding on the river. A torrent of stormwater, turned earthy brown by suspended sediments, thundered through Conowingo's floodgates. The huge injection of stormwater during the tempest provided what Hirsch calls a "natural experiment" to confirm his earlier observation.
He looked at data from a monitoring station at Conowingo and found that phosphorus was escaping the dam's reservoir at a high rate. That by itself was not surprising. On average, about three-quarters of the phosphorus entering the Chesapeake Bay from the Susquehanna River hitchhikes on sediment particles. And during storms, large amounts of stored sediment are scoured off the riverbed and the Conowingo reservoir's bottom. Any nutrients stuck to those particles get carried into the Bay.
However, phosphorus was escaping the reservoir at a much higher rate than during other high-flow events a decade or more ago. "I was just flabbergasted about how high some of the numbers were," Hirsch says. "I thought, boy, something is going on here."
That prompted Hirsch to look more closely at what was going on, and over a longer period of time than that covered by a single large storm. He had the benefit of a new software tool he and his colleagues at USGS had developed. The tool has a name only a statistician could love: WRTDS, meaning "weighted regressions on time, discharge, and season." The name tells you something about the problem the tool was meant to solve. It's a formidable scientific challenge to describe the long-term changes in the amounts of sediments and nutrients that rivers deliver to the Chesapeake, given the huge daily variations in river flow and the natural cycle of seasonal changes. In dry periods, the amount of sediments and nutrients falls; during floods, it spikes. Flows change hour to hour, day to day, and year to year.
WRTDS removes the influence of river flow, revealing subtle long-term trends lost in the background like a whisper in a noisy restaurant. Thanks to advances in statistics and desktop computing power, WRTDS is a more sensitive tool for spotting such trends than previous techniques.
Using WRTDS, Hirsch found that over the past 30 years — from moderately high river flows to the highest floods recorded — the average annual amount of phosphorus delivered to the Bay by the Susquehanna was increasing over time. The bottom line: Conowingo was running out of space to store sediments and the nutrients riding on them.
"It came out of the blue," says Lewis Linker, coordinator of modeling teams at the Chesapeake Bay Program. "We thought the dam would continue trapping for a long time, but we were wrong."
For decades, the reservoir behind the Conowingo Dam (top) has trapped nutrients that otherwise would have fueled low-oxygen "dead zones" in the Bay. Studies after 2011's Tropical Storm Lee helped reveal that Conowingo's trapping powers are almost exhausted, requiring adjustments to the Bay model. Lee washed sediment into the Bay, turning its waters muddy brown (bottom). Photograph, Michael W. Fincham; Satellite Image, NASA
Because of the new evidence, Conowingo suddenly became a top-priority issue for Linker and managers of the Chesapeake Bay cleanup. Less trapping meant more sediments and more nutrients would reach the estuary. Additional phosphorus could feed dead zones, and extra sediments could hamper the growth of underwater grasses. As a result, the states might have to make additional cuts to reach their mandated pollution diets. To guide that decision, the modelers would need to use the new findings to adjust their Bay in a box.
Much work remained to be done to confirm Hirsch's findings and connect them to the Bay model. Fortunately, Hirsch was not the only detective on the Conowingo case. Qian Zhang, then a doctoral candidate in environmental engineering at the Johns Hopkins University, was working with his advisor, Professor Bill Ball, to study the flow of sediments and nutrients in the Susquehanna. With funding from Maryland Sea Grant, Zhang delved deeper into using WRTDS to expand on Hirsch's findings.
Hirsch had examined total nitrogen and phosphorus passing the Conowingo Dam. Zhang took that analysis a step further by estimating how much of the total was particle-bound hitchhikers and how much was nutrients dissolved in the water. The large majority of the dissolved nutrients flow by the dam without being trapped, so quantifying the amount of sediment-bound particles was important to Zhang — it could show whether the Conowingo was trapping less.
Sure enough, Zhang found that particle-bound nitrogen and phosphorus have both been rising in the flow exiting the Conowingo Dam, thus confirming what Hirsch's results suggested. Further studies by Zhang also pointed to the same conclusion: Conowingo is trapping less and less sediment as time goes on. The current estimate is that as little as six percent of the dam's total storage capacity is left.
Ashes and Oxygen
When the Conowingo stopped trapping nutrients, what would happen to water quality in the Bay? Would oxygen levels drop? To comply with the pollution diet, would the states surrounding the Bay have to tighten their belts further? "Now you will have to accommodate that loss of trapping by keeping [more of] that material on the landscape and not allowing it to move downstream," Hirsch says.
To inform those decisions, the modelers at the Chesapeake Bay Program got to work revising the Bay model. The watershed portion of the model was updated to include the extra nutrients flowing past the Conowingo. And Cerco, the program's lead estuary modeler, examined the effects in the estuary using the water quality model he helped create. He actually works with two models linked together: one that simulates the movement of water in the estuary and one that reproduces the chemical and biological processes in the water that determine algae growth, water clarity, and oxygen levels. In the linked model, a grid of rectangular boxes of water fill the Chesapeake Bay's volume from the bottom to the top. The model simulates the movement of water from box to box, shuttling nutrients and sediments between them like a firefighter's bucket brigade. Equations crunch the numbers, calculating the impacts of the sediments and nutrients on water quality in the boxes.
Cerco knew that a key determinant of water quality is how quickly the sediments release their hitchhiking nutrients into the estuary's water column, where they can foster algae blooms and potentially worsen low-oxygen conditions. Some of the Conowingo sediments are highly "reactive" and therefore tend to release nutrients more quickly and in greater amounts. Other sediments are chemically cold and just sit on the Bay's bottom and do nothing, like wood that has been burned to ashes in a campfire.
Jeff Cornwell, a sediment chemistry researcher at the University of Maryland Center for Environmental Science, provided key data needed to calculate the impact of an increased influx of Susquehanna River nutrients on Bay water quality. Photograph courtesy of Jeff Cornwell/University of Maryland Center for Environmental Science
To understand the sediments' effects on Bay water quality, Cerco needed to know what percentages are hot (highly reactive), lukewarm (slightly reactive), and cold (inert). "Can the living parts of the Bay, like the algae, use it? Or has it been worn out and what's left is just ashes?" Cerco says. "If it's all highly reactive, you have a potential problem."
To provide Cerco with answers, Jeff Cornwell did some new research. Cornwell is an expert on sediment chemistry at the UMCES Horn Point Laboratory. Working with one of his master's-degree students, Zoe Vulgaropulos, he conducted experiments on samples of the ooze from the bottom of the Conowingo reservoir.
In 2015 and 2016, Cornwell and Vulgaropulos boated out on the reservoir five times, lowering sampling rigs to the bottom to punch out cores of sediment. In total, they collected about 70 cores and 20 water samples containing suspended particles.
Back at Horn Point Laboratory, the researchers placed sediment samples in sealed, glass vials that were incubated without oxygen for up to nine months. They periodically measured changes in the levels of nutrients and gases in the vials resulting from chemical reactions in the sediments.
Using these measurements, scientists could then work backward to calculate the reactivity of the sediments that had caused these changes. Jeremy Testa of UMCES' Chesapeake Biological Laboratory and Jim Fitzpatrick of the consulting firm HDR Inc. collaborated on calculations to quantify the relative portions of hot, lukewarm, and cold sediments in this mix. They determined that most of the sediments were only slightly reactive or not reactive at all — in other words, ashes.
With that information, Cerco calculated the effect of the Conowingo sediments on low-oxygen zones in the Chesapeake. The EPA's pollution diet is designed to make sure that dissolved oxygen in the deep waters of the estuary never falls below 1.0 milligram per liter of Bay water, particularly in the summer when hypoxia-creating conditions are at their peak. The water quality model found that Conowingo's escaped nutrients could fuel algae growth that would reduce oxygen levels in the deep waters by an average of 0.1 milligrams per liter over a summer season — a reduction of 10 percent.
It seems like a small reduction, but it has potential consequences for managers at the Chesapeake Bay Program. Reducing the volume of the estuary affected by hypoxia is one of the core goals of the pollution diet, so the managers pay close attention to anything that chips away at dissolved oxygen.
"A tenth of a milligram doesn't sound like a lot," says Johns Hopkins' Bill Ball, "but when it's at the borderline between being hypoxic and not being hypoxic, suddenly the volume [of the low-oxygen zone] goes up a lot." In some areas of the Bay at the knife-edge of hypoxia, even a small nutrient nudge could push the area out of compliance with EPA water quality standards. The Chesapeake Bay Program estimated that the extra nutrients flowing past the Conowingo could cause the deep channel regions of the Bay to miss the standard for dissolved oxygen one percent of the time during a summer season, on average.
What should states do about the Conowingo's decreased trapping of nutrients? It might require reducing nutrients by larger-than-expected amounts in other parts of the Chesapeake's watershed to compensate. But that decision is up to the managers of the Bay cleanup, not the modelers. The modelers work to describe the causes of degraded water quality and offer information to help figure out possible solutions. "The managers can look at the different options," says Linker, "and what it would take to address it."
A Warmer and Wetter Bay
In addition to the increasing flow of nutrients down the Susquehanna, the Chesapeake Bay Program's managers realized that the estuary was undergoing other changes that could require further refinements of the Bay in a box. A big one was the effects of climate change.
The Chesapeake Bay Program's managers asked the modelers to simulate those outcomes because climate change is expected to have wide-ranging and potentially harmful consequences for the estuary. Heavier rainfall and higher river flows could wash more nutrients and sediments into the Bay. Warming of the estuary's waters could make hypoxia worse. And sea level rise could harm water quality by submerging and killing coastal wetlands, which capture nutrients and keep them from reaching the deep channels of the Bay.
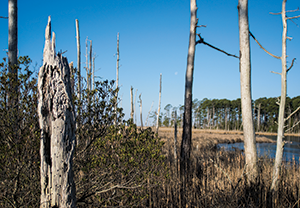
At Blackwater National Wildlife Refuge, forested lands are transitioning to marsh as sea levels gradually rise. Saltwater seeps into the soil, killing trees. Preliminary climate projections suggest that 50 years from now, rising water could begin to drown a significant area of the Chesapeake's tidal wetlands. Photograph, Nicole Lehming
The modelers looked at the effects of climate change over two time spans. One was the period up to the pollution-diet deadline of 2025. But the modelers were also asked to start projecting effects as far out as 2050 to give managers a sense of what lies ahead.
For the short-term, the modelers think they can give a reliable forecast by extrapolating from a reliable source of long-term data: an 88-year record of rainfall in the Chesapeake Bay region. When they fed that data and some related assumptions into the model, it yielded a preliminary estimate that river flow would increase by 2025, and this flow would boost the amount of both nitrogen and phosphorus entering the estuary by up to two percent. The amount of sediment would rise by up to five percent. That could have an impact on pollution diets when Bay managers reexamine them in 2018.
A brighter bit of news was that a projected rise in sea level of one foot by 2025 would lead to minimal loss of the Bay's coastal wetlands overall.
But when the modelers looked beyond 2025, they quickly realized that it becomes much more difficult to make reliable predictions. That is because there are different scenarios about how much climate might change globally depending on how successful industrialized nations are at cutting carbon emissions. And across different scenarios, there are wide variations in likely increases in rainfall and temperatures and, to a lesser extent, sea level rise. Nevertheless, the various models tend to agree that after 2050, sea level rise could begin to appreciably chip away at the Chesapeake Bay's wetlands.
The modelers plan to continue to incorporate a range of "what if" scenarios of climate change in 2050 and beyond. In part, they'll need to continue to make judgments about which of the various possible scenarios appears most likely based on the best available evidence — evidence that may emerge only gradually over time.
Hard work, but necessary, says Zoe Johnson, climate change coordinator for the Chesapeake Bay Program. "It's very important to keep abreast of the changes," she says, "so we can ensure that the Bay restoration and protection effort is built to be successful in the face of future impacts."
Lost in the Shallows
Besides incorporating the effects of climate change, the Chesapeake Bay modelers are eyeing other ways to use science to improve the Bay in a box after 2025. One such upgrade could improve the model's simulations of processes in the shallow regions on the fringes of the estuary, less than six feet deep. Modelers have long struggled to mimic these areas accurately using the Bay model.
It's important to simulate the shallows accurately because they provide critical habitat for fish, crabs, and oysters. But nutrients and oxygen levels predicted by the model weren't even close to actual measurements. "We have called them our problem children," Linker says.
The difficulty arises because the computer model can't accurately reproduce the fine physical details of these shallow areas, including the Bay's coastline, marshes, and tributaries. The underlying problem is the coarseness of the grid the model lays over the estuary to subdivide it in "boxes" of water in which the model's equations work their magic. Making the boxes small enough to fit into all the nooks and crannies in the shallow areas would vastly multiply the number of boxes of water the model's equations would need to crank through. As a result, the model would take too much time and too many expensive computer resources to run.
Because the model's grid doesn't include all the nooks and crannies, it can't accurately track small-scale and fast-paced changes in water flow, salinity, and nutrients in shallow areas of the estuary. For example, one detail the model has trouble representing accurately is subtle rises and dips in the contours of river bottoms. "The topography of the river bottoms affects how salt water moves up the tributaries and how fresh water moves down," says Raleigh Hood of UMCES. "Simple things like that can affect how well the model works."
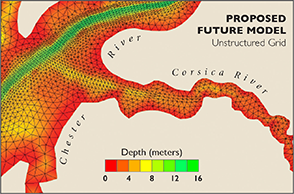
One possible solution the modelers have discussed is changing to a radically different way to segment the model Bay called an unstructured grid. It would allow them to use a fine grid of triangle-shaped compartments to simulate the complex shallows but use much larger triangles in areas like the open water. Applying a fine grid in open water would not make the model's projections there much more accurate and would unnecessarily lengthen the time it took to run the computer model.
The Model's Next Generation
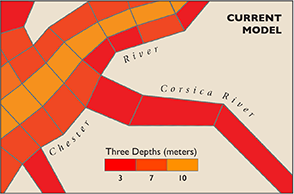
Top graphic, Chesapeake Bay Program; Bottom graphic, Joseph Zhang (VIMS); Map, Sandy Rodgers and iStockphoto.com
Today's simulations of the Chesapeake estuary divide the Bay's shoreline and shallow areas into relatively large boxes or "cells" (top, left). But this approach approximates roughly the complex physical features and processes of these zones. A new generation of models (left) may be coming that uses smaller, triangular cells to depict in finer detail the nooks and crannies in the shallow zones.
Many Models
An even more fundamental proposed change in the art and science of Bay modeling: run multiple models in tandem to better inform the restoration effort.
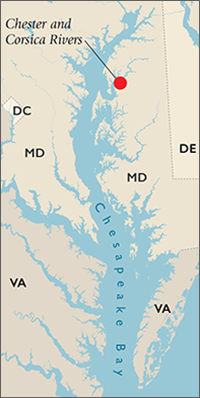
Researchers have already started to use multiple models in hopes of improving the accuracy of the Bay in a box. For example, a project is underway to test new state-of-the-art models in the Chester River and compare them to the Bay model's predictions for that same tributary. The point of this modeling comparison is not to declare a single winner, but to identify the models' strengths and weaknesses. "What do different models do better or worse and why?" Hood asks. The answers could help to design a better Bay model.
Hood is a proponent of eventually running multiple Bay models in tandem to produce a range of projections to guide decisions about managing the estuary. Using just one model makes it harder to get a handle on its uncertainties — the range of projections of water quality that the Bay model produces. Knowing the range would make it possible to estimate the potential for mismatches between model projections and real-world measurements.
This combination modeling approach is already the standard in climate science. "That ensemble tells you what the uncertainty is," Hood says. The ensemble tells you the range of variability in predictions of how much the climate will change. "And," he adds, "we can do exactly the same thing in estuarine modeling."
Carl Cerco, who helped create the present one-model approach to simulating the Chesapeake, sees advantages to running multiple Bay models, but he believes the approach raises new headaches for the managers. It might lead to conflicting recommendations about what measures are needed to improve water quality, inviting disagreements among competing interests in the restoration. If one model calls for expensive changes in farming practices and another model doesn't, would farmers push back against the expensive option? How would managers choose?
Model Reality Check
For the time being, the restoration partnership relies on everyone buying into a single model. To help assure trust in the accuracy of its projections, the modelers rely on a rigorous reality-check called calibration. They compare the model's simulations of how the estuary worked in recent decades to actual observations of how the Bay worked in reality during those years. The Chesapeake Bay Program's massive three-decade database of observations draws on a variety of sources — including monthly water sampling cruises down the waterway's mainstem to measure nutrient levels, dissolved oxygen, and water clarity. Monitoring stations on streams throughout the watershed also collect data.
Calibration ensures, for example, that the model's simulations of nutrient levels in particular parts of the Chesapeake in past years match reasonably well the nutrient levels actually measured in those parts. A close fit provides confidence that the model can accurately predict the estuary's response to future reductions in nutrients — and that the simulated Bay and real Bay act similarly enough that the model can help to guide management decisions about how to restore the estuary to health. The closer the model is to reality, the better the tool is for measuring whether the pollution diet is on track to success.
It's never a perfect fit. The Bay in a box is a simplified version of a very complex system, and the real-world observations of the Chesapeake that modelers use to reality-check their digital Bay are incomplete and based on averages of daily, monthly, and annual conditions in the estuary. The creators of the Bay model have carefully adjusted it to try to minimize mismatches between predicted and real-world nutrient levels by fine-tuning the model's equations and underlying assumptions. The result is a digital Bay that can be made to behave enough like the real estuary to produce trustworthy projections and guide management decisions in the future.
Is the latest draft of the Bay model better than the last one? It's a difficult question to answer, says Gary Shenk, who oversees the watershed modeling effort for the Chesapeake Bay Program. "There isn't a simple number we can point to for measuring improvement," he says. However, all of the changes in the latest version of the model make it a more realistic representation of the estuary, Shenk adds, and so "they give us greater confidence that the predictions of load changes due to management scenarios are more accurate."
Hood says the model's ability to accurately predict the effect of changes in nutrients on oxygen levels indicates that the model responds like the real estuary, as the managers of the Chesapeake Bay cleanup effort need it to. And for oxygen, it's not a trivial task.
"The model simulates oxygen draw-downs very well," Hood says. "If you increase nutrient loads, oxygen goes down; if you decrease nutrient load, it goes up."
Dominic Di Toro, a professor at the University of Delaware and one of the architects of the original model of the Bay, takes a longer view of the model's accuracy. The early version, he admits, was crude, but he has watched the model's sophistication and scientific foundations grow substantially since then.
Di Toro's verdict on this history: "It's important to realize that the model has withstood multiple calibrations, multiple scientific studies, and multiple reviews," he says. "It has been punched around a lot and it doesn't fall apart."
Cerco's Final Draft
Carl Cerco is one of the original architects of the computer model of the Chesapeake estuary that helps guide the Bay restoration. He retired in January 2017 after 30 years of work. Future generations of Chesapeake modelers will continue to build on Cerco's work but might make fundamental changes in how the model mimics the processes that determine water quality. Photograph, Dave Roberts/ERDC PAO
Before completing a full-scale calibration of the new and improved version of the Bay model, Carl Cerco still had quite a bit of tinkering left to do with his Bay in a box. For the first time, the model would be able to explicitly mimic the effect of tidal wetlands in removing nitrogen from the estuary's waters. He would also add the ability to simulate how the increasing numbers of oyster-growing operations and sanctuaries are affecting water quality by removing nutrients and organic particles.
The to-do list is long but time is short. Cerco officially retired in January 2017 but is staying on for a while to finish what he started. His career has entirely overlapped six generations of increasingly sophisticated Bay models, and the next guru of Chesapeake water-quality mimicry will likely end up building on what Cerco has laboriously constructed since the 1980s.
Modelers strive for progress — not perfection. "There is always more to do, but at some point you just have to move forward," Cerco says. "You have to take the best model you have and say, okay, it's done."
As he hands over the Bay model to the next generation, Cerco is grateful to have had the chance to contribute to building a model of the largest estuary in America and providing a science-based foundation for the most far-reaching and complex pollution diet in EPA history. "When this project came along it was the opportunity of lifetime," he says, "and it still is."
Fine-Tuning a Map of Land Uses
From the air, the Chesapeake Bay's watershed looks like a vast checkerboard, dotted with different kinds of land uses. You can see farms, forests, housing subdivisions, and parking lots.
Scientists who are building computer simulations of pollutants in the Bay have worked to identify and map those many types of land use in detail. This knowledge matters because fields and forests soak up more stormwater than paved areas. Hard surfaces like roads and roofs allow more stormwater carrying excessive amounts of nutrients and sediments to flow into the estuary. By categorizing land uses at a detailed, local level, scientists can create a big-picture view of the amounts and sources of pollutants harming the Bay and how to reduce them.
A team led by Peter Claggett of the U.S. Geological Survey spent years building a new database of land uses across the Chesapeake's watershed that contains more fine-grained information at a smaller scale than the previous version did. The new database will be used to help improve the accuracy of a revised version of the computer simulation called the Bay model to be completed in 2017.
Sources: ESRI, Digital Globe, GeoEye, and Peter Claggett (USGS)
The left map, showing downtown York, Pennsylvania, reflects data used in the 2010 version of the Bay model. Based on Landsat satellite imagery, it shows features 30 meters (100 feet) square and larger. At this level of detail, most of central York appears as a red blob of hard surfaces like roads, roofs, and sidewalks.
The right map shows the same area of downtown York based on the new database of land uses that is more detailed and fine grained. You can see features as small as 1 meter (3 feet) square. A more diverse mix of land use types is visible; besides paved areas are areas covered by trees. The new database includes information from aerial photos and airborne laser scanning studies (LiDAR) of the land surface.
Move the slider to the left or right to compare the two models.
We invite you to read our blog, On the Bay, for frequent updates and analysis about environmental science and coastal issues involving the Chesapeake Bay and Maryland's coasts.
If you study, manage, or care about protecting the Bay ecosystem, we think you will find a lot to interest you. See the latest posts here.
Would you like to receive an email whenever we publish a new post to this blog?
Email us and we'll put you on the list.